Rarely can entire markets be characterized by a broad, sweeping statement. Instead, we often find there are “markets within markets” – pockets of the stock universe that are behaving quite differently than the broader group. Often, these pockets are the areas that offer the most opportunity for investors.
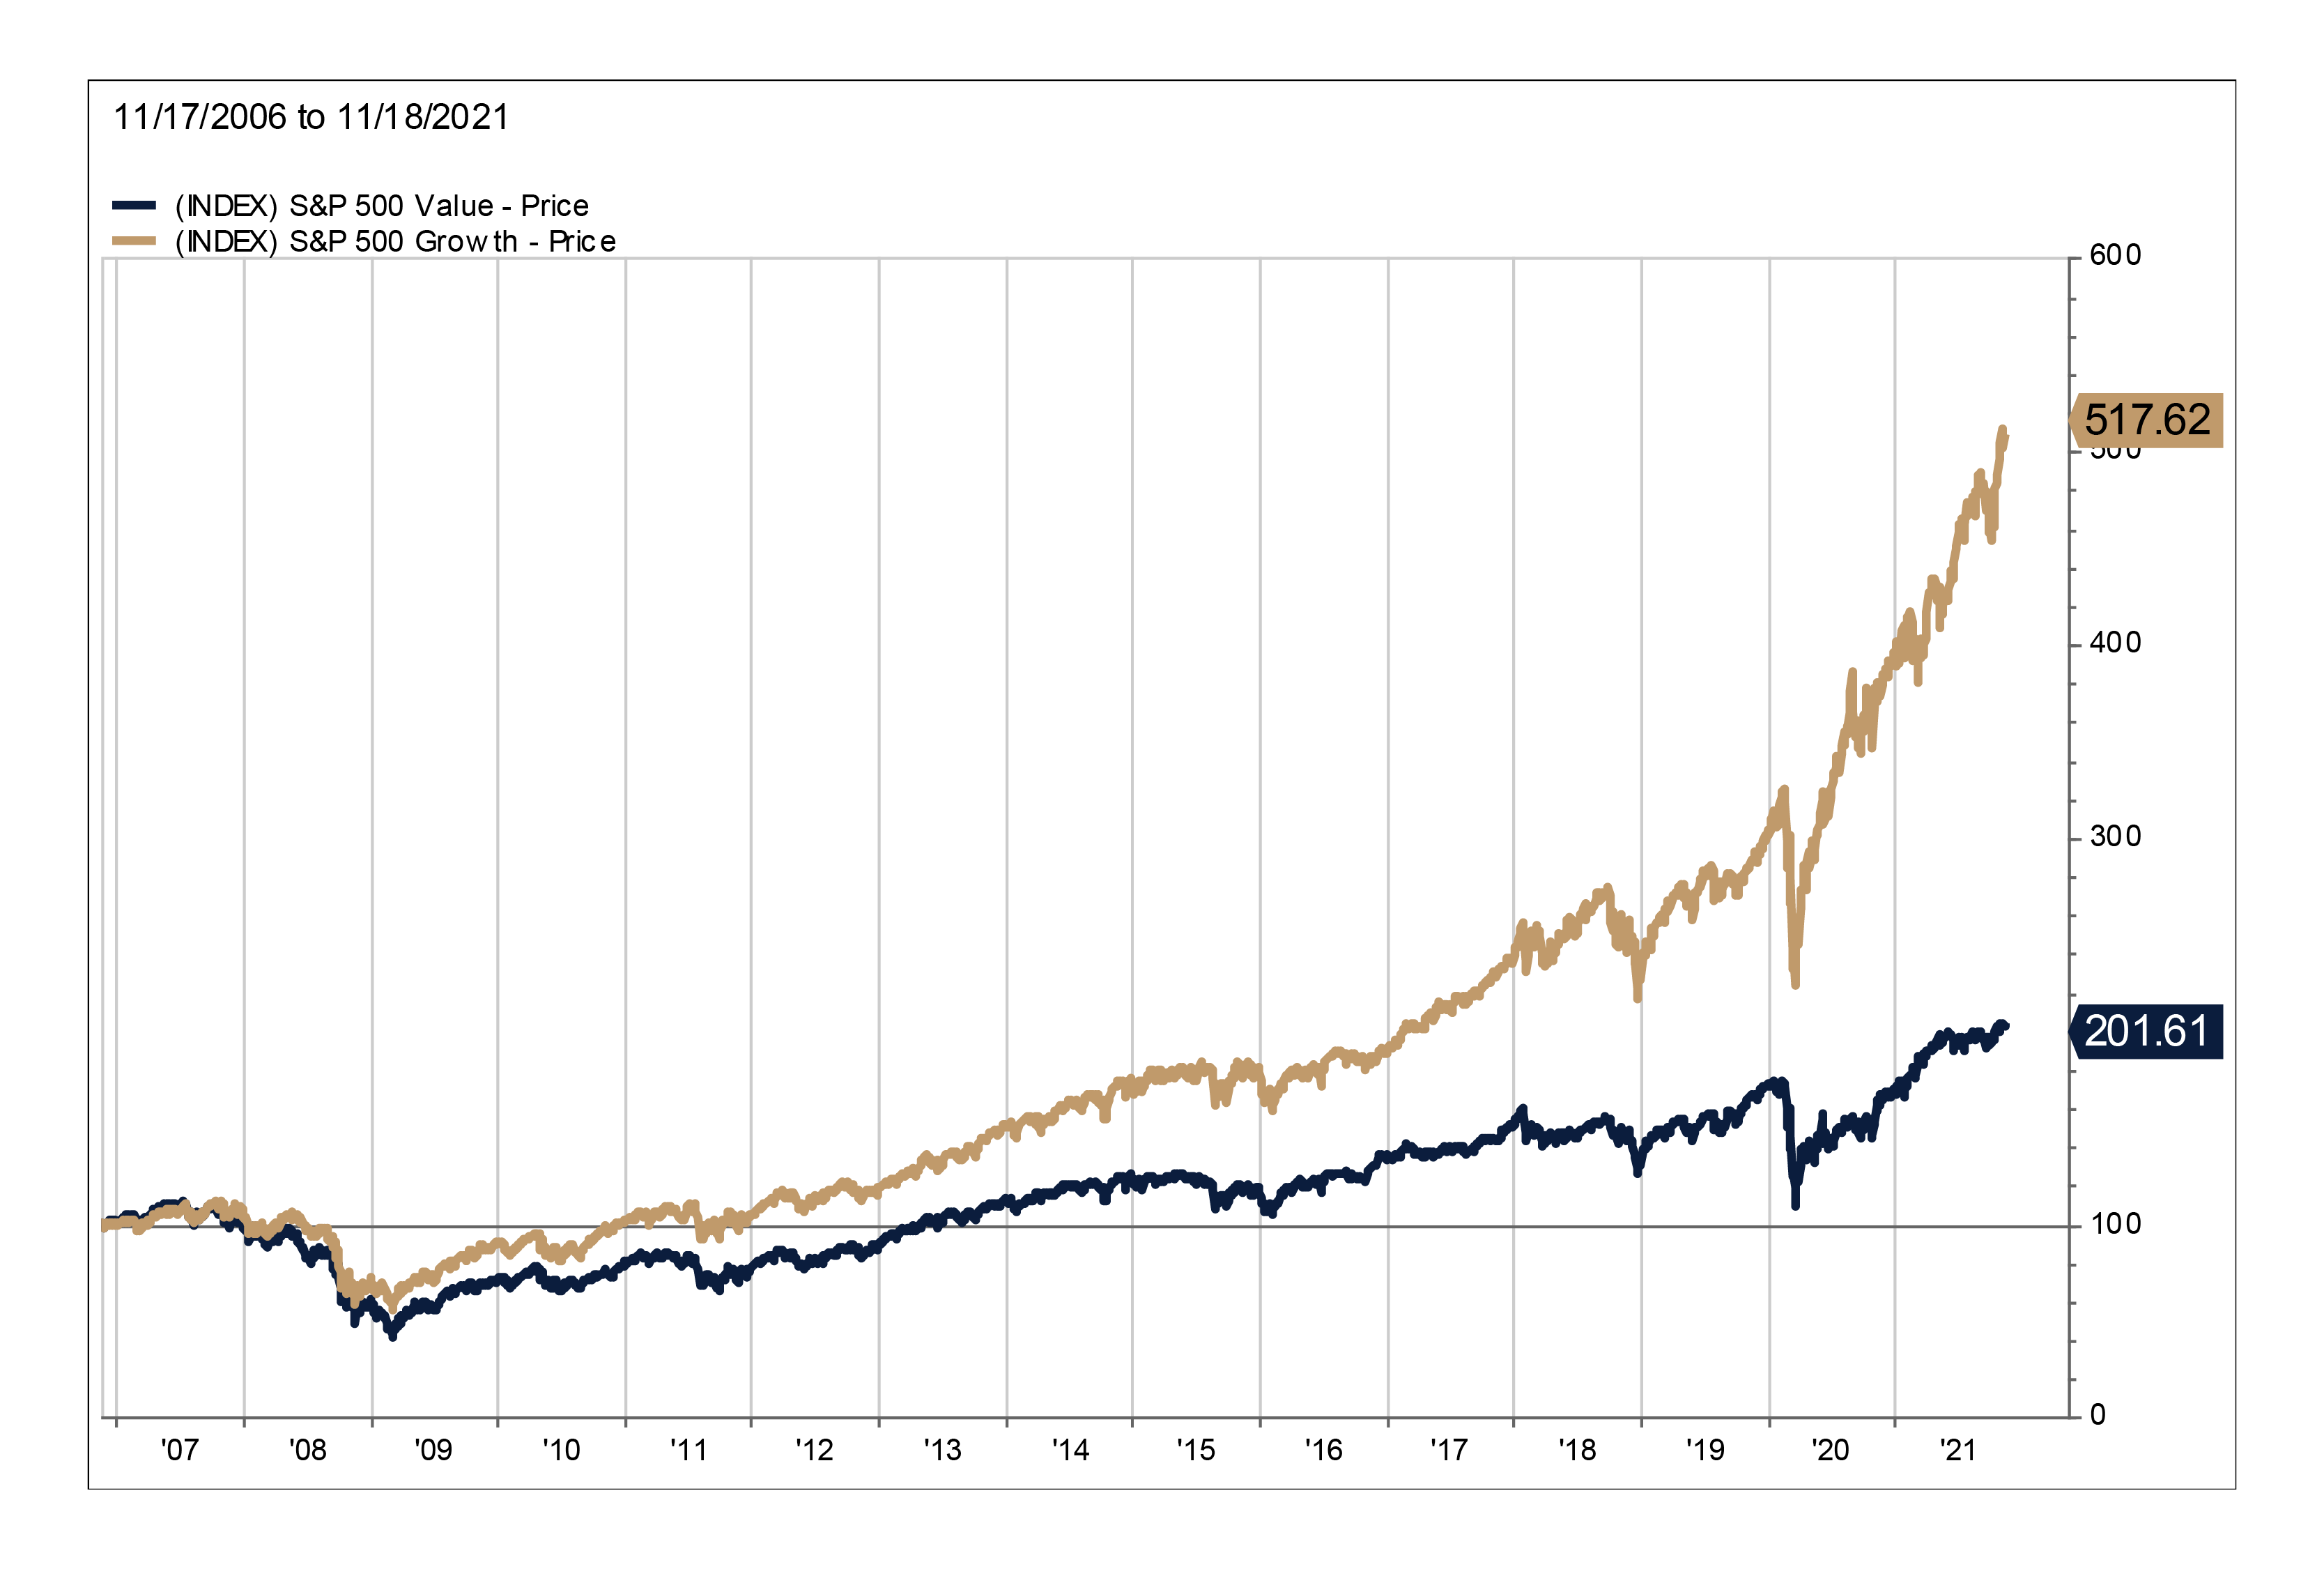
In today’s environment, we find several market divergences that are worth taking note of, and this blog shares charts that put those divergences in perspective. Our first chart shares an extreme differential we have discussed in prior blogs: the performance gap between growth and value.
Growth stocks have dominated value stocks since the financial crisis, due in large part to ultra-low interest rates, which lower the discount rate of future earnings and make them worth more in today’s dollars.
However, with interest rates rising due to inflation concerns, we wouldn’t be surprised to see the trend reverse, with value stocks outperforming growth on a relative basis. Given the long period of outperformance by growth, that reversal would seem overdue.
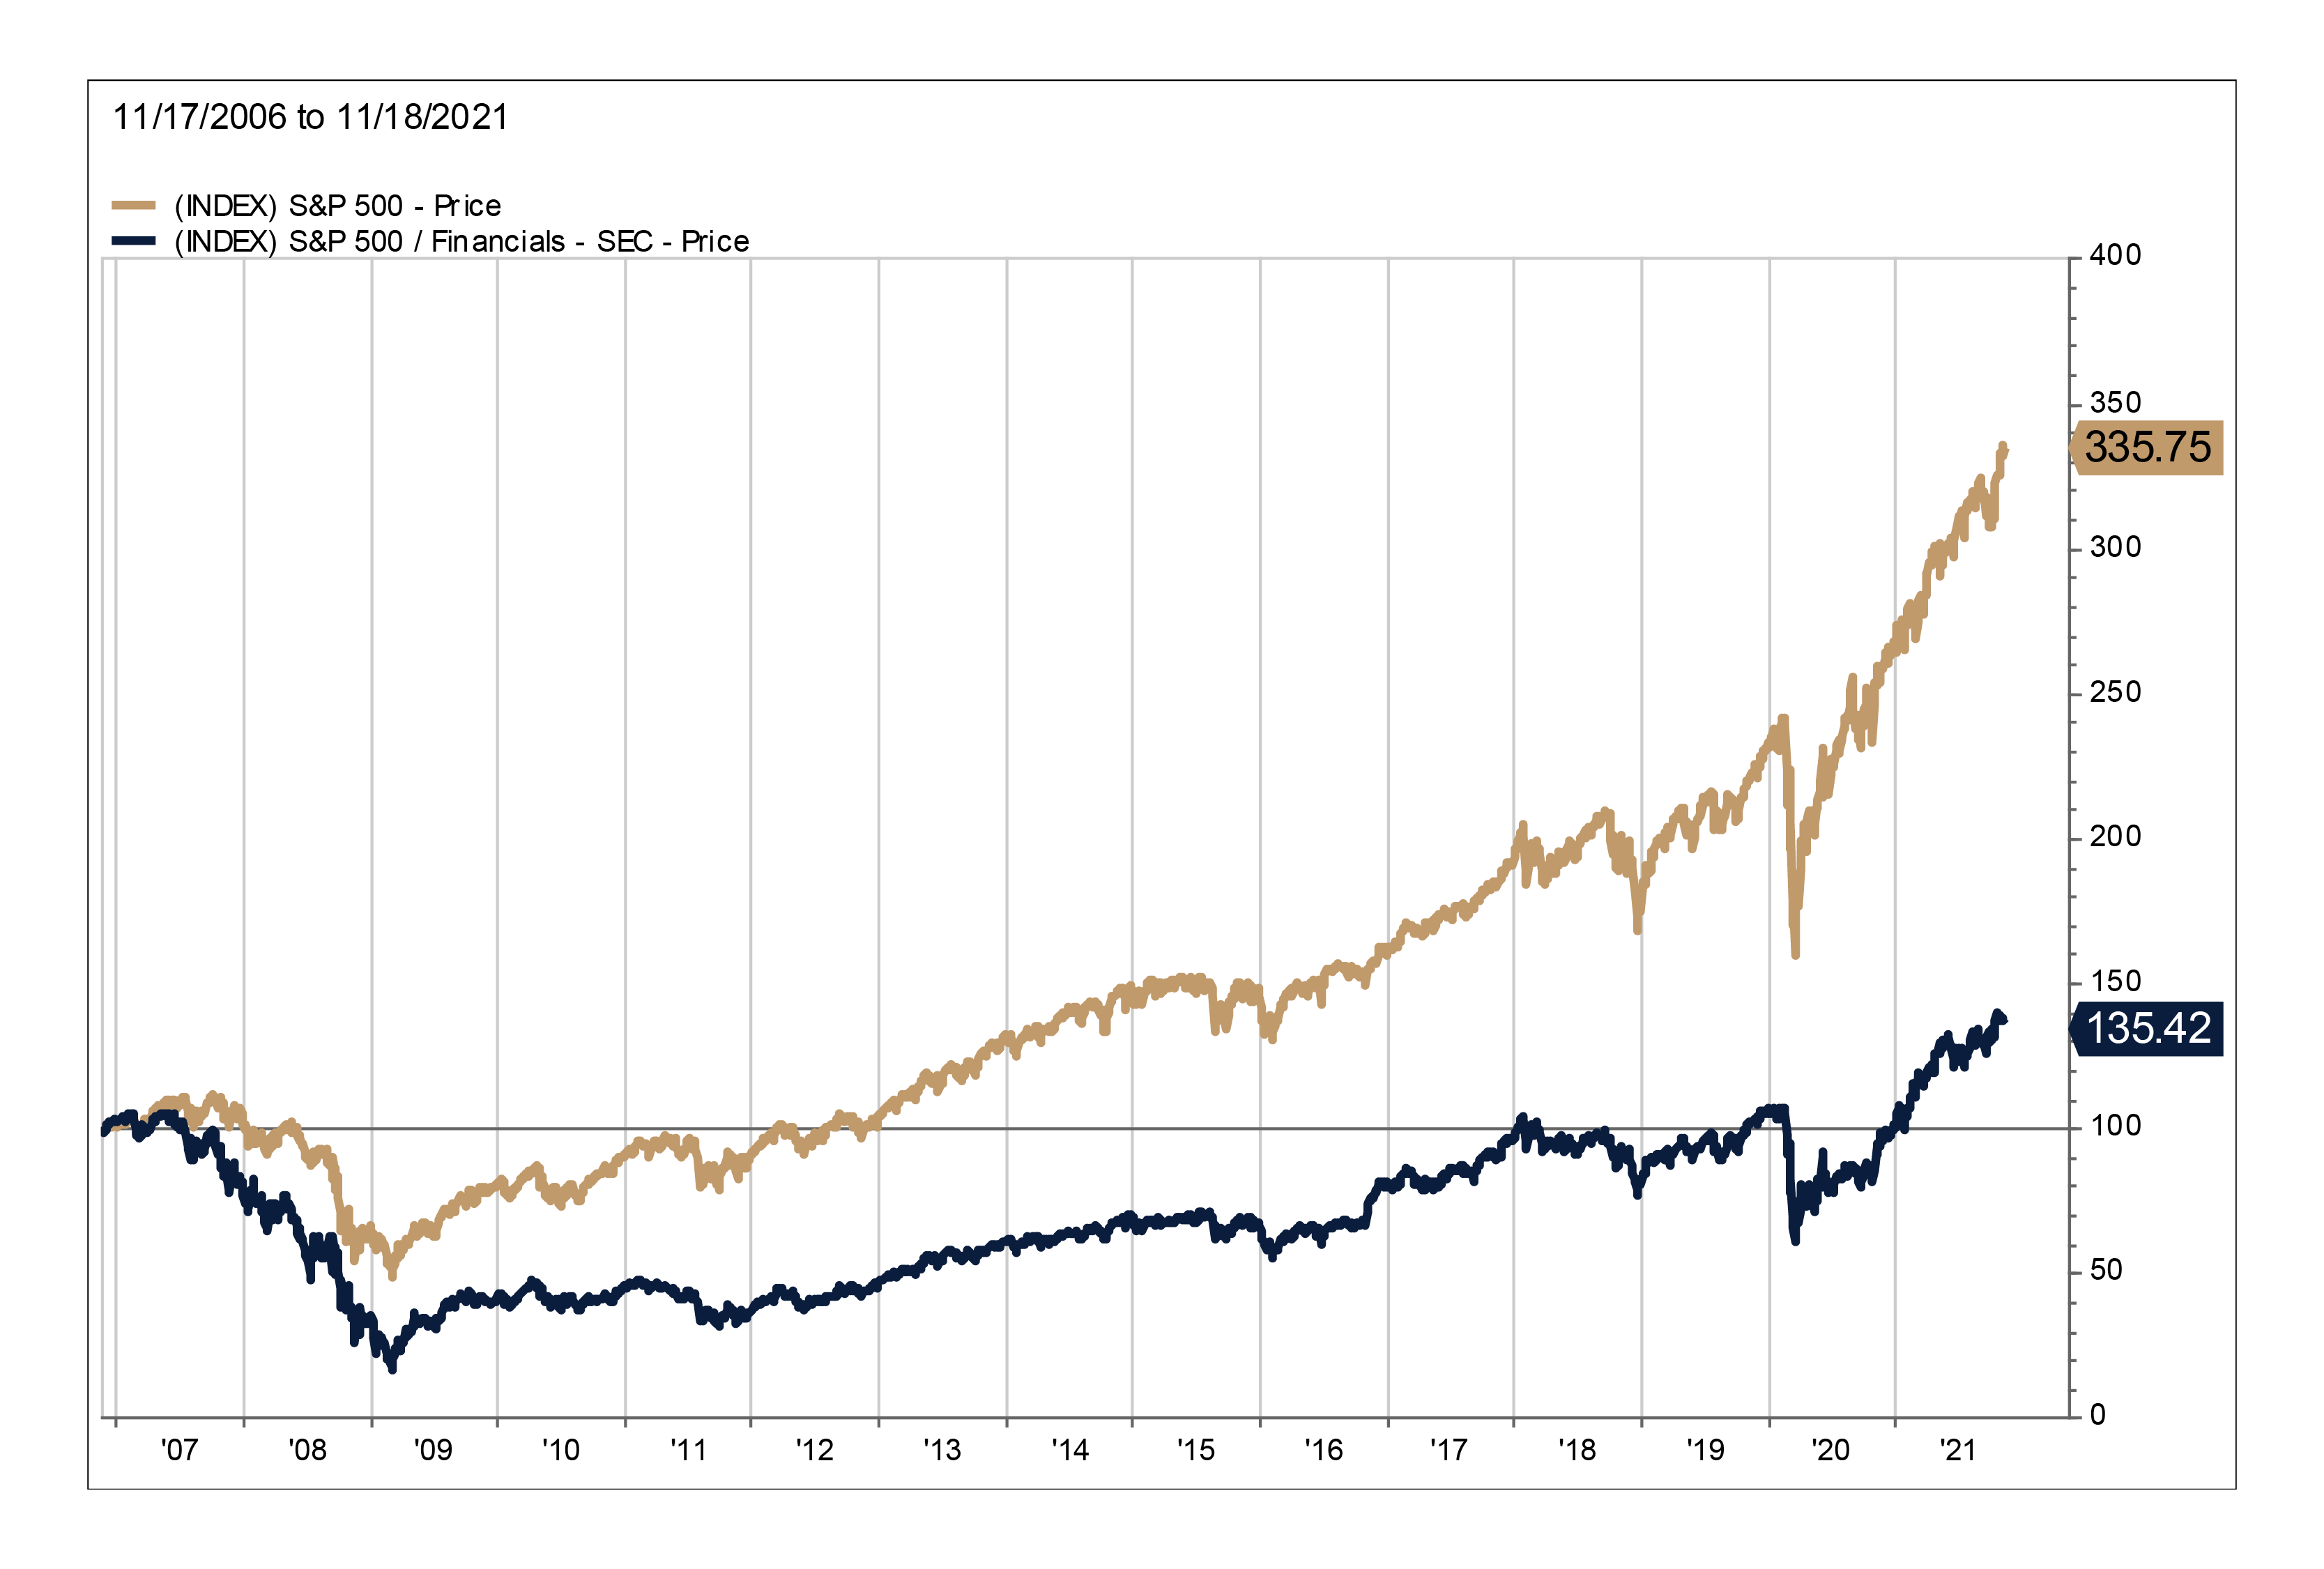
The next chart shows the divergence between the financial sector and the broader market. Financial stocks have lagged for a couple reasons. Low interest rates are bad for banks’ net interest margins and also for insurers’ earnings. Value stocks have also been out of favor, which hasn’t helped the sector. But we believe financial stocks’ fortunes could be poised to reverse. Just a whiff of higher interest rates and better economic growth would provide a boost to earnings. Further, as we have discussed previously, a robust bank M&A environment is also a tailwind for select stocks in the sector.
Another trend that seems unusual to us is the underperformance of small cap stocks. Typically, small caps lead during an economic recovery, and they did until the spring of 2021. Their recent underperformance suggests to us that the market is calling the economic recovery into question. As we mentioned in a prior blog, rarely have small cap stocks been this attractive relative to large caps.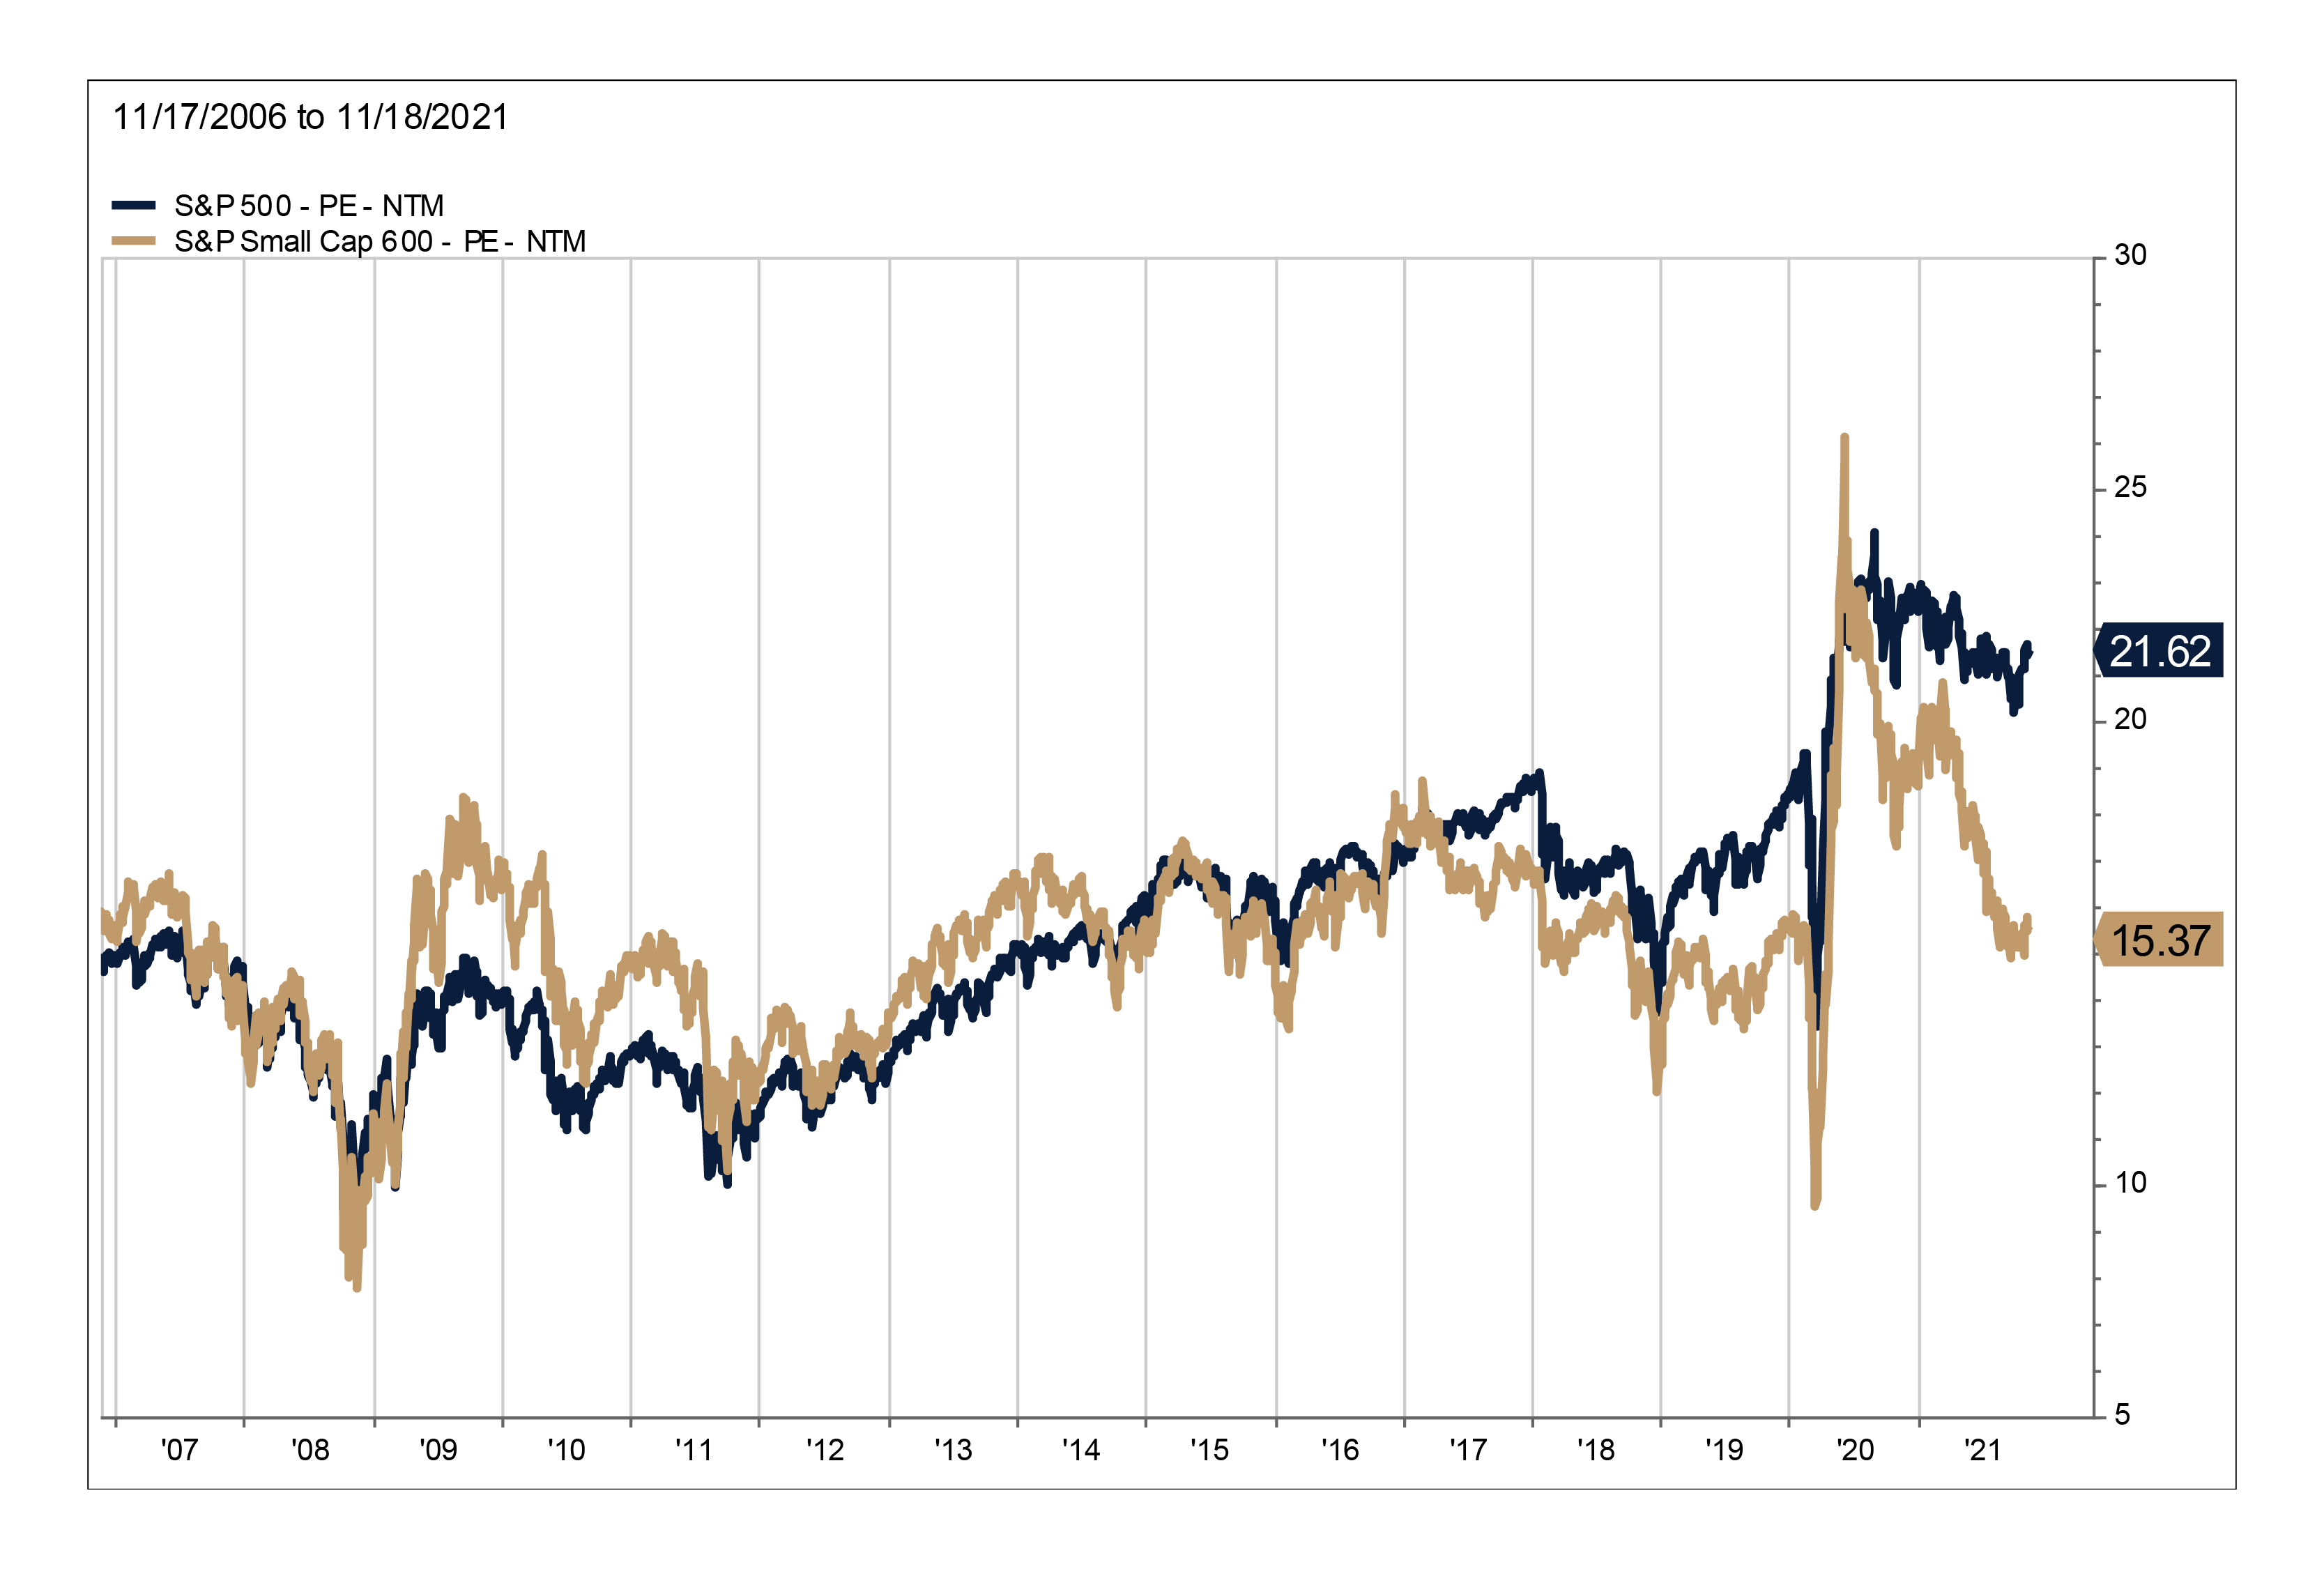
Each of these charts suggest to us that while there is much talk about stocks being overvalued, there are still areas where investors can find value. One just needs to look for the markets within markets.