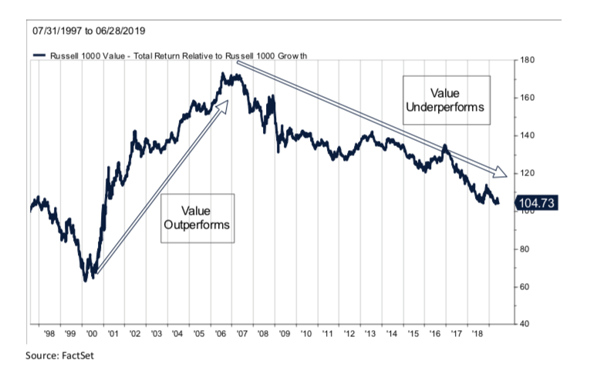
As can be seen in the chart below, value investing has underperformed growth investing significantly over the past thirteen years. This has resulted in broad market benchmarks such as the S&P 500 and the Russell 1000 tilting further and further towards growth investing as a consequence of their market cap weighting methodology. As long as the growth over value cycle persists, boosted by the powerful passive over active cycle, value portfolios will continue to struggle to beat increasingly growth-tilted general market benchmarks.

Consequently, value investors continue to experience redemptions, further exacerbating the down cycle.
Are all value investors the same? Do they utilize a common set of techniques to select stocks and construct portfolios? The short answer is, no. Underneath the value investing umbrella, portfolio managers utilize a wide variety of strategies and techniques such as: low price to earnings ratio, low price to book value, high dividend yield, private market value (PMV), free cash flow yield (FCF), low price to earnings before income taxes, depreciation and amortization (EBITDA), and pure contrarian investing.
All these techniques have merit and many serve to reinforce others. At Prospector, we heavily rely on two of these techniques in order to identify value and we are especially attracted to situations where we can use both at the same time. Our fundamental favorites are PMV and FCF.
Private Market Value (part 1):
Private market value can mean different things to different people. At Prospector, we engage in two types of private market value analysis. First, there is the most common PMV technique which is to compare the selling price and metrics of whole companies which have been sold to independent third parties to the metrics of share prices (which are partial, minority stakes) of public companies in the same industries. If the public shares sell at a meaningful discount (creating a margin of safety) to the implied takeout prices, that could create an opportunity for a successful investment if there is a decent chance that the public company would agree to a sale within a reasonable timeframe. A corollary PMV analysis we execute is to calculate the PMV of various units of a diversified company in order to determine if a wide discount exists between the value of the public share versus the sum of the parts of the company on a PMV basis if management were to sell parts of the company rather than the whole.
A relevant example of this type of analysis is our sum of the parts (SOTP) work on Berkshire Hathaway (BRK-A/B). We have developed, over a very long time, a proprietary model whereby we strive to measure whether the company is selling at a discount or premium to our SOTP analysis. Simplistically, we start by calculating the required capital each of Berkshire’s insurance units would need were they to be standalone companies. Our history of analyzing insurance companies (and serving on insurance-company boards) gives us valuable insight here. From that, we then determine how much of their investment portfolio would be considered “excess capital” and we mark the stock portfolio to market. Then, we attribute a private market value to Berkshire’s other, non-insurance subsidiaries and also take into consideration parent-company debt. We feel our Berkshire SOTP model has done a good job through the years of signaling buy points and sell points for the stock.
Next week, we will elaborate on the second type of PMV analysis we perform at Prospector, which involves transforming a GAAP balance sheet into a statement of net asset value (NAV), and also our Free Cash Flow analysis.
If you would like to be notified when we release new insights, please let us know! Just complete the form on this page and we will deliver our content to your inbox once per week.


