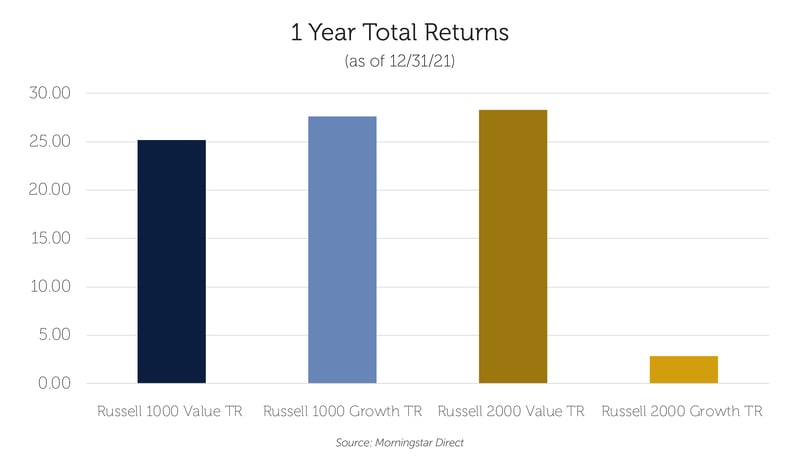
Few would quibble that 2021 was a strong year for stocks. But how strong, and where did those returns come from? Take a guess on the 2021 returns for the four indices below, then scroll down to see the actual numbers, and our perspective on what it means.
-
Russell 1000 Value Index
-
Russell 1000 Growth Index
-
Russell 2000 Value Index
-
Russell 2000 Growth Index

Returns Revealed
Did you take your best guess? Here’s a look at the answers. First the large cap indices:
-
Russell 1000 Value: 25.12%
-
Russell 1000 Growth: 27.59%
Now for the surprises. Look at how things ended up for small caps:
-
Russell 2000 Value: 28.22%
-
Russell 2000 Growth: 2.82%
The Takeaway: Profitability Matters
The returns of the market caps and categories offer a couple of instructive points. For one, after a long period of dominance by growth stocks, we are seeing signs that value may be returning to favor. We have spoken about this in prior blogs, but with upward pressure on interest rates (which has a greater effect on growth companies whose future earnings are discounted at a higher rate when rates rise) we would not be surprised if this trend continued.
The relative underperformance of the Russell 2000 Growth Index also stands out. Within the index are many companies that don’t produce positive earnings. The median loss-making stock was down over 20% for the year, and this group was responsible for the index’s low returns.
While overall equity returns were strong for the year, the performance of this subgroup serves as a reminder that valuation ultimately matters, and while momentum can drive stocks for a while, those that aren’t backed by fundamentals tied to profitability and cash flow generation ultimately come crashing back to earth.


