Multiple expansion has been a tremendous contributor to the outperformance of growth stocks since the Global Financial Crisis. Has it gone too far?
The below chart illustrates the valuation differential between deep value and high growth stocks since the late 1980s. One can see that the difference today is as wide as it’s been since the dot-com bubble in the early 2000s. It’s also important to remember how truly ridiculous the valuations for internet-related companies were during that point in time, and how today, it is again these same types of companies that are driving the disconnect in valuations.
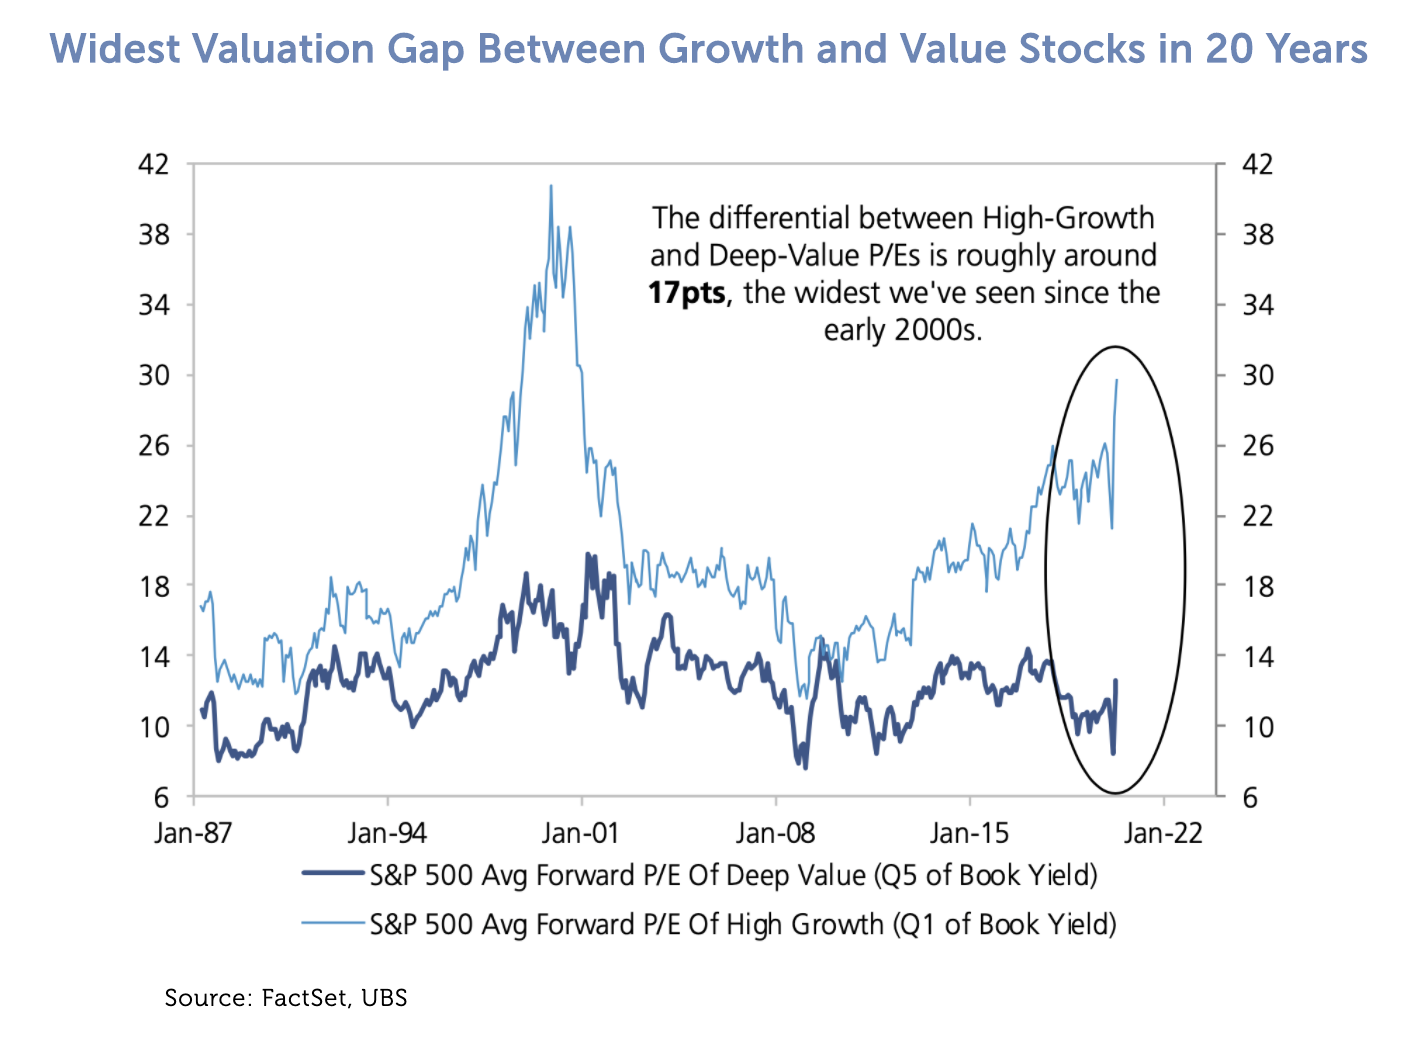
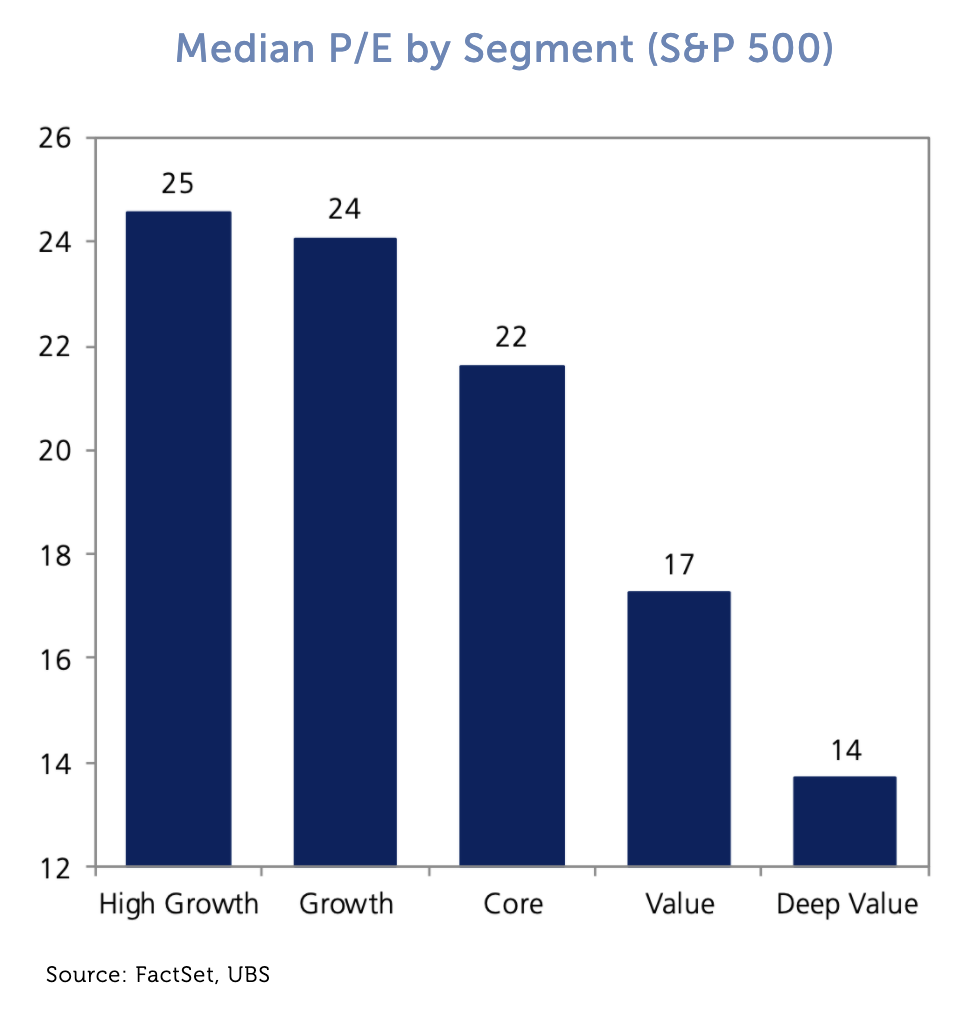
While the chart above uses average forward P/E ratios of the deep value and high growth segments within the S&P 500 Index, the story is the same when looking at median P/E ratios. As one can see by the bar graph below, the difference between median P/Es across these two groups is approximately 11x (25x P/E for high growth versus 14x P/E for deep value).
If the last time valuations were this disconnected was in the early 2000s, when even unprofitable “dot com” names traded at expensive valuations, it’s not unreasonable to think a bit of mean reversion may be on the way for equity markets.
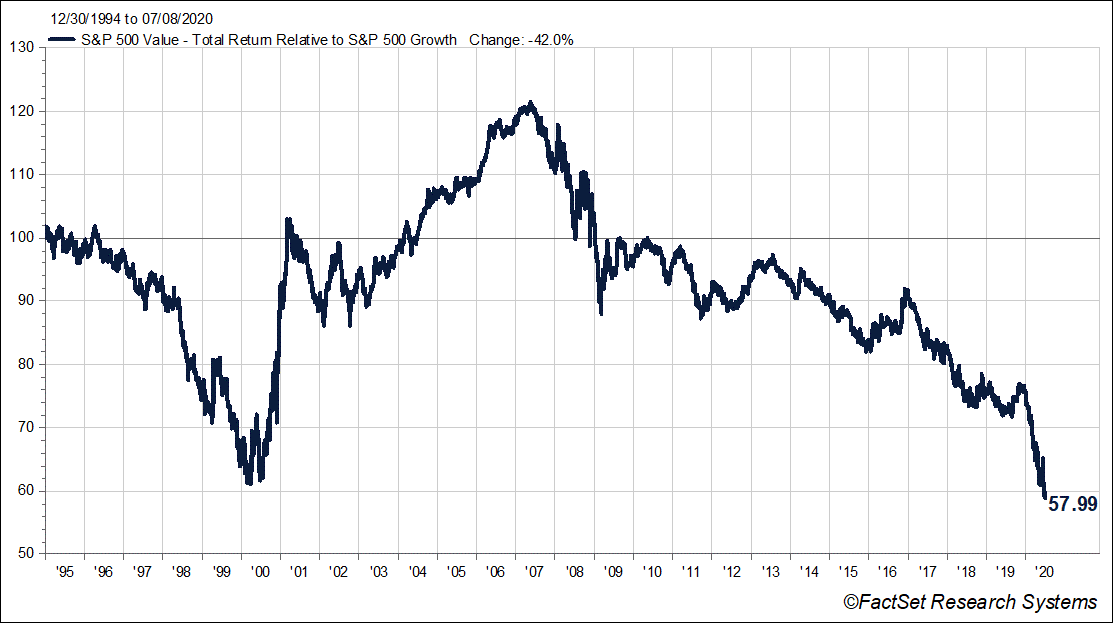
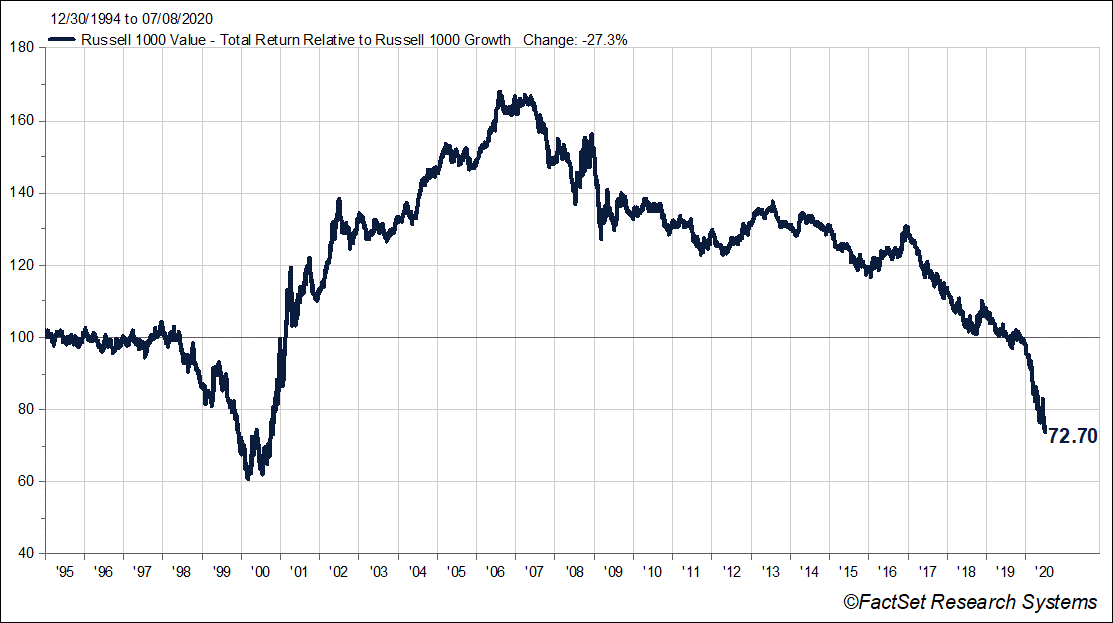
The two charts below show what that meant for value stocks last time. The first chart displays the total return of the S&P Value Index relative to the S&P 500 Growth Index and the second shows the total return of the Russell 1000 Value Index relative to its growth counterpart. In both cases, an upward sloping line indicates value is outperforming.
As these charts demonstrate, the next several years following the dotcom bubble were a period of significant outperformance for value stocks. They may be poised for a similar run again.