Now that the sun has set on one of the most volatile quarters in recent memory, let’s assess the damage. Broadly, large cap indices like the S&P 500 held up better during the selloff, as illustrated by the graph below.
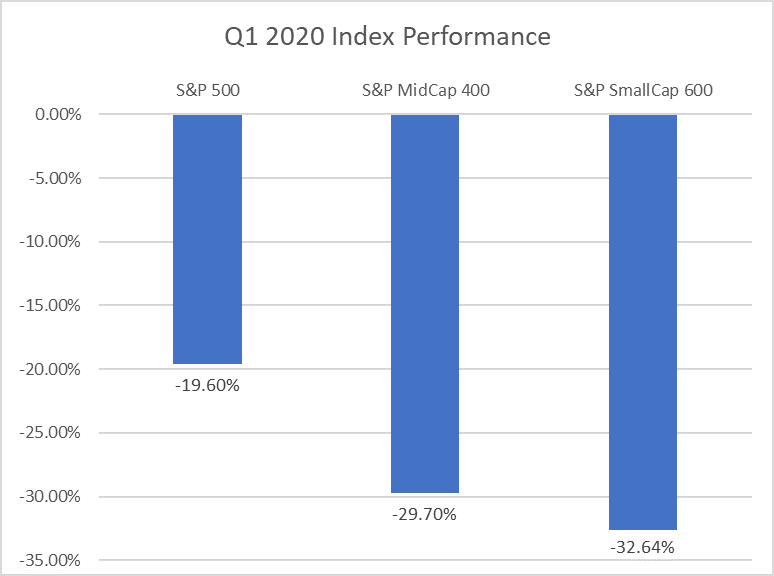
The outperformance of large caps isn’t surprising and is consistent with past market corrections, as there is typically a “flight to quality” sentiment during these periods. Investors tend to shift from “riskier” small caps to larger companies with established brands and diversified revenue sources, as well as those with higher dividend yields (on average). During a selloff, the dividend aspect is usually an especially appealing characteristic of owning large caps, and a premium is usually placed on high dividend payers since the income helps offset stock price weakness.
Which makes it all the more interesting that high-dividend stocks actually performed relatively poorly during the quarter. Observe the performance of different factors below:
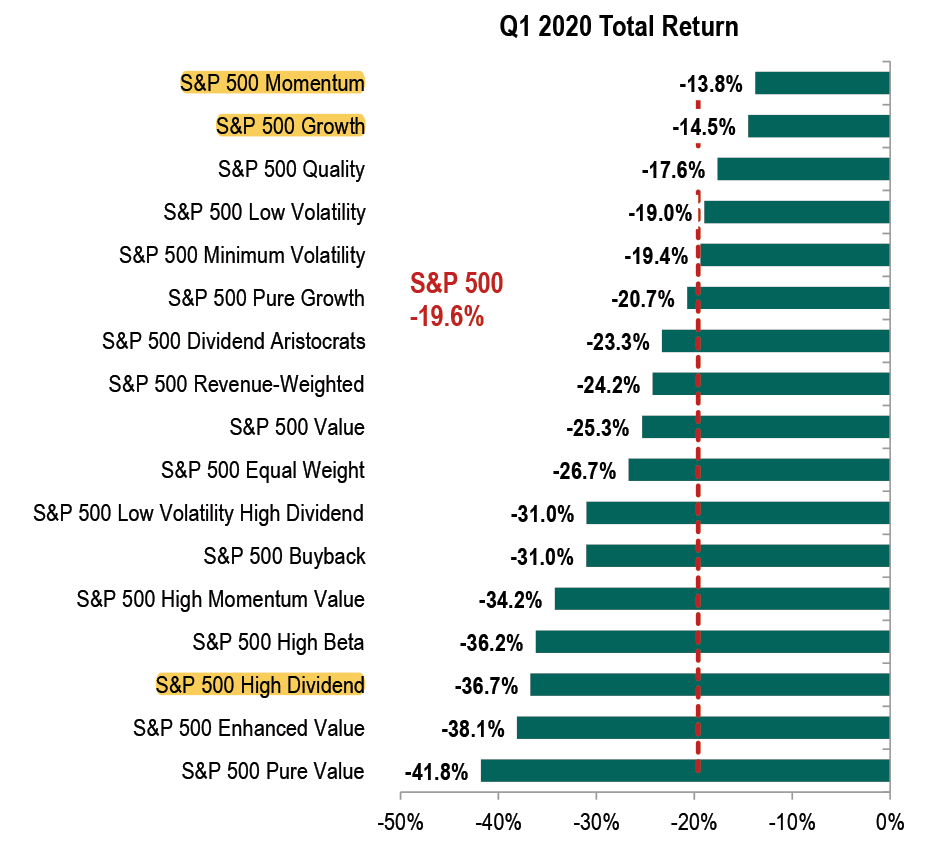
Source: S&P Down Jones Indices
The big takeaway from this chart is how well momentum and growth stocks held up. Usually during down quarters, investors think twice about the relatively high (if not sky-high) valuations they’re paying for growth stocks and we usually see a tilt back toward more reasonably-priced value stocks. Especially considering these are types of companies that tend to pay out healthy dividends. But both value and dividend payers were dramatically out of favor.
Growth and momentum – the same two factors that are usually associated with the FAANG stocks that drove the market higher during 2018 and 2019 – continued their run of outperformance. What contributed to this unexpected trend? Part of it could be explained by investors’ bias to these names which have been big winners for years, so investors were likely “buying the dip” as the stocks became discounted.
Taking a closer look, the nature of this particular economic contraction favored the underlying business models of technology stocks. Social isolation, restrictions on travel and the crash in oil prices wreaked havoc on many sectors such as energy, industrials, materials and consumer discretionary. Expectations for the Fed to keep interest rates at zero also weighed on rate-sensitive financial companies. However, the information technology sector fared relatively well. Analysts are expecting large tech companies’ Q1 results to reveal that their business lines fared better than the overall economy during the quarter, given the importance of their services to large enterprises. Further, many high-growth, large index constituents like Amazon, Alphabet, Facebook and Netflix likely saw upticks in demand for certain services. For example, Amazon likely benefited from families staying home and conducting shopping online, as well as demand for its Amazon Prime streaming service.
Hamish Preston of S&P Dow Jones Indices hit the nail on the head in terms of sector divergences:
At a sector level, there was no place to hide to avoid declines in absolute terms in Q1: all S&P 500 sectors finished down for the quarter, only the seventh time this has happened since the end of 1989. However, there was enormous value in identifying the relative winners or avoiding the relative losers: a whopping 38.5% separated the best performing sector in Q1 (Information Technology, -11.93%) and the clear laggard (Energy, down 50.45% amid oil prices plunges). This quarterly difference was the highest since December 2001, and reflected a dramatic increase in stock and sector dispersion.”1
So where does this leave us? Asset managers who tend to be compared to the S&P 500 Index likely underperformed, unless they are more of a growth equity manager. Any portfolio with a value or dividend focus likely performed poorly. The primary drivers of performance had more to do with exposures to sectors than any other factor, with the big winners being information technology and healthcare. Going forward, given the liquidity challenges facing many industries, strong balance sheets and free cash flow will be of critical importance in terms of companies being able to weather the storm and service their debt.
If you would like to be notified when we release new insights, please let us know!
Just complete the form on this page and we will deliver them to your inbox once per week.

1 https://www.indexologyblog.com/2020/04/01/volatile-start-to-2020/