Slowing global economic growth. Heightened valuations. The longest bull market in U.S. stock market history. A yield curve that spent part of 2019 inverted. Investors have had plenty of reasons to get defensive and raise cash, and many have done exactly that.
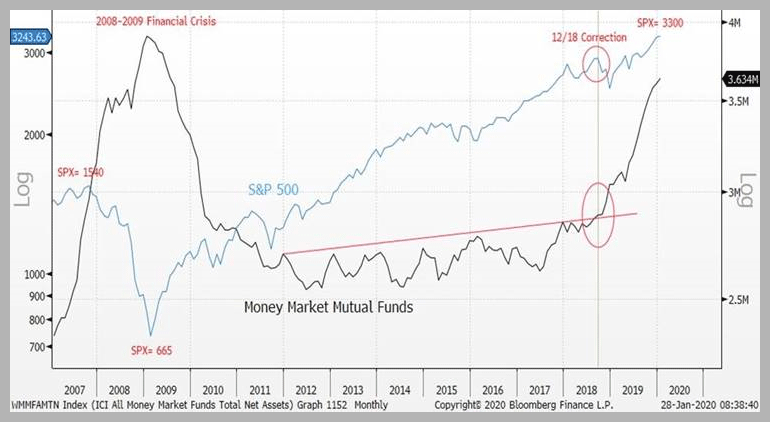
2019 was a bit of an anomaly in the way that capital poured into cash-like vehicles like money market funds, yet the S&P 500 Index had a massive return of over 30%. If that strikes you as odd from a supply/demand standpoint, you’re not alone, but don’t forget that robust stock buyback programs have taken some supply out of the equation. Today, current levels of money market assets are matched only by levels seen during the depths of the Global Financial Crisis, as indicated by the below chart.
Source: Janney Montgomery Scott LLC
Another interesting aspect of the chart is the acceleration in flows into money market funds during the selloff in Q4 2018, which gained considerable momentum after the recovery had already taken place and carried on throughout 2019.
Similar to yield curve inversions, build-ups in money market funds have had some use in predicting market corrections. However, the timing is difficult, with significant build-ups usually preceding large-scale selloffs like 2000 or 2007 by anywhere from two to four years.
On the flip side, if the Fed’s three rate cuts in 2019 work their way through the economy and provide the intended stabilization, it’s not hard to envision some of this capital flowing back into equities and providing a tailwind for this late-cycle rally. No matter which scenario plays out, having a high-quality equity manager that will provide clients with exposure to further upside while striving to limit downside participation should continue to be a sound strategy moving forward.