The equity markets have rallied considerably since their March lows. In fact, the S&P 500 Index has rallied to such an extent (down just 11.1% year-to-date through May 14th) that it barely seems to portray an underlying U.S. economy that just had 33 million people file for unemployment benefits. The disconnect between job losses/U.S. GDP contraction versus stock market performance has been making headlines, for good reason.
US Unemployment Rate
2013 - Current
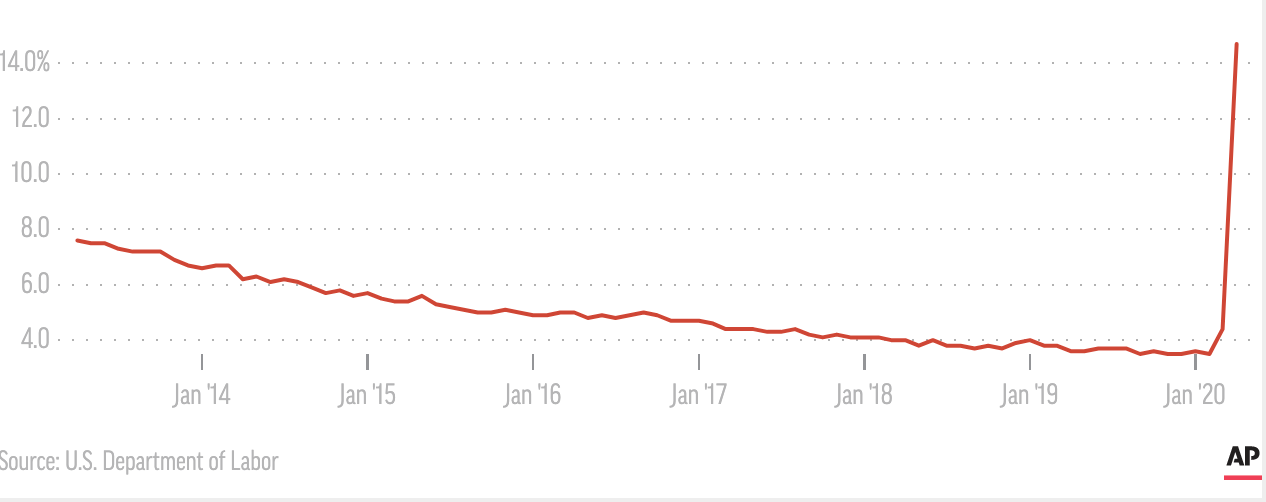
Source: https://abcnews.go.com/Business/us-economy-lost-205-million-jobs-april-unemployment/story?id=70558779
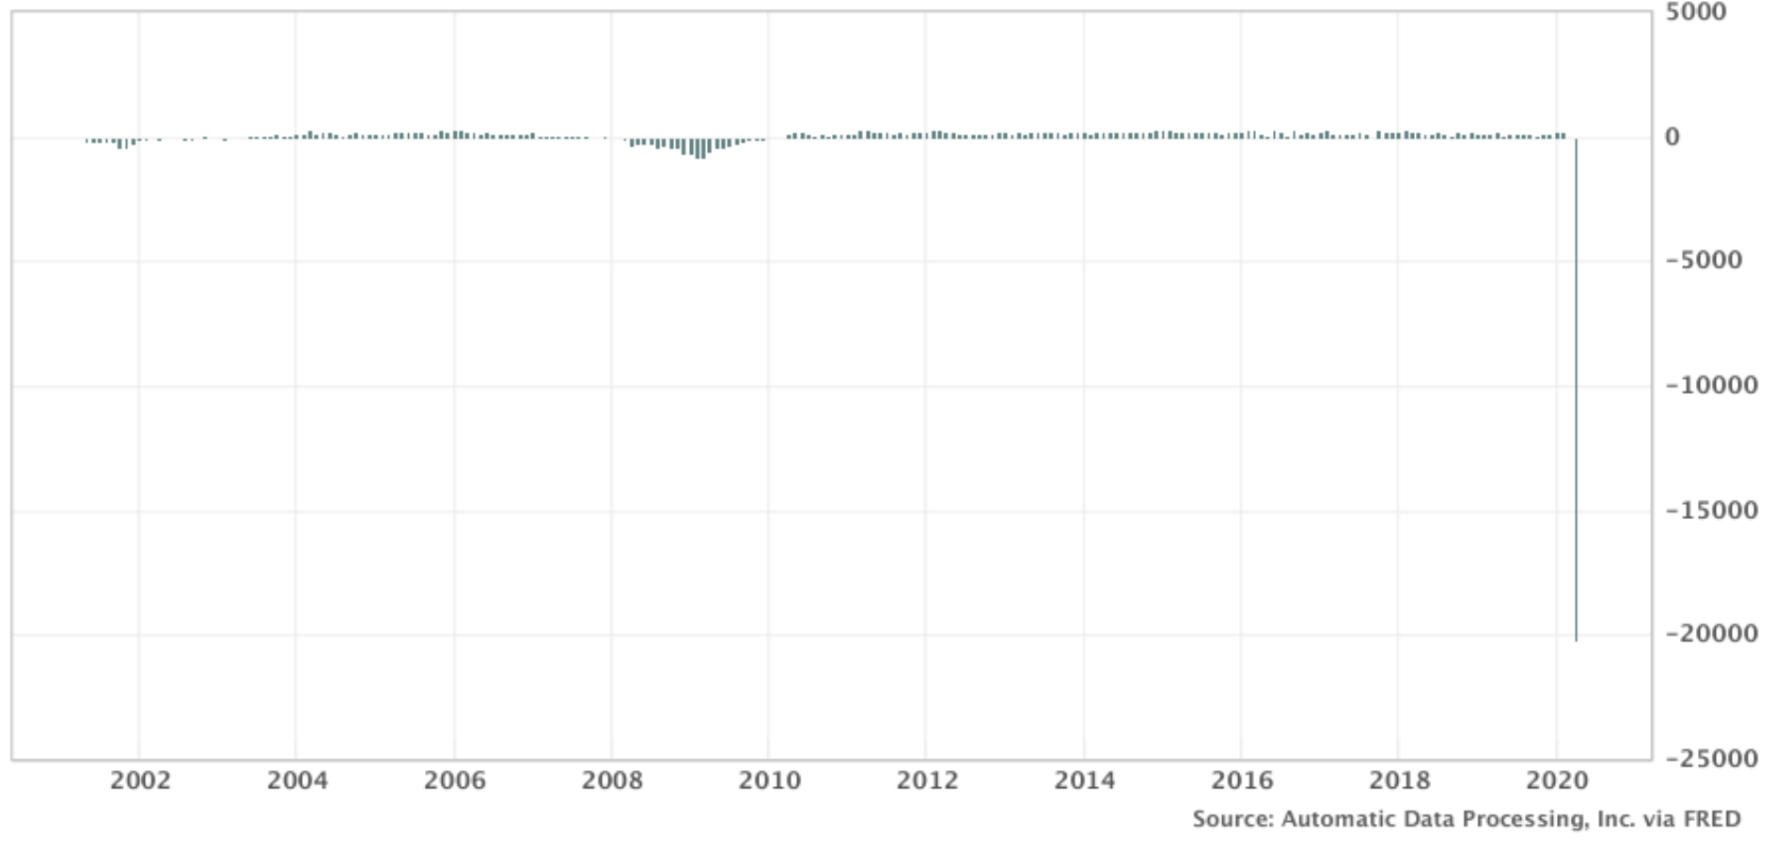
As indicated by the above chart, current unemployment stands at approximately 14.7%. In April alone, payroll company ADP reported 20.2 million private-sector jobs were shuttered.
ADP Private Sector Jobs Growth
2001 - Current
In Thousands, Seasonally Adjusted
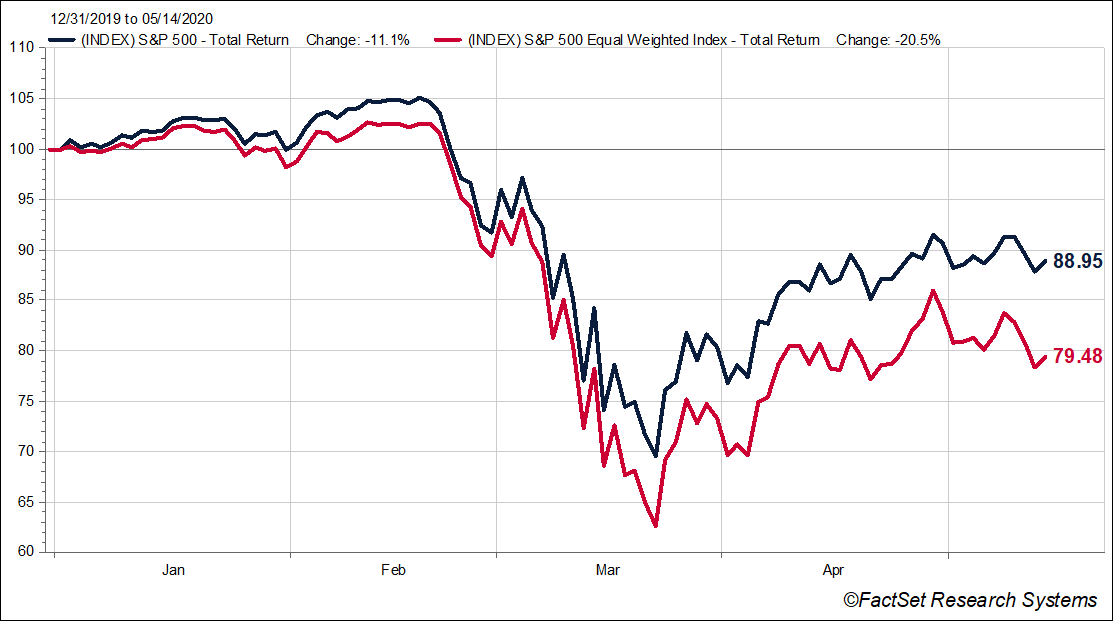
Compare the dismal visuals above to the following chart below which displays the year-to-date performance of the S&P 500 Index (which is market cap-weighted) and the Equal-Weighted S&P 500 Index.
S&P 500 Index and Equal Weighted S&P 500 Index
Growth of $100
Year-to-date 2020 as of 5/14/20
While we believe equity markets have gotten a bit ahead of themselves, especially regarding large cap growth names, there are multiple explanations for the disconnect between the weakness of the underlying economy relative to the strong recovery seen from stocks. The most obvious is that market participants are forward-looking and company earnings nine to 12 months from now tend to matter much more than today’s numbers. As an example, approximately 18 million Americans included in the recent job loss figures expect their unemployment to be more of a temporary layoff, and this fueled market optimism around a potential employment snap-back once stay-at-home restrictions are lifted.
Another explanation has to do with the chart above: the question of whether market capitalization-weight indices like the S&P 500 are truly reflective of the overall economy. The outperformance of FAANG names (Facebook, Apple, Amazon, Netflix and Google/Alphabet) as well as Microsoft over the past five years has resulted in these six companies making up nearly 22% of the S&P 500 Index, with the other 494 companies accounting for the remaining 78% of the Index as of May 14th. Keep in mind that those 494 companies include many of the largest companies in the country in terms of the number of people they employ as well as their contribution to U.S. GDP.
With this in mind we return to the question: is an equal-weighted basket more representative of the underlying economic conditions? Certainly looking at the above performance, -11.1% year-to-date performance for the traditional cap-weighted S&P 500 Index versus -20.5% for the equal-weighted ETF, the equal-weighted methodology seems to paint a more sober picture of the current economic situation. This is also more in line with the performance of mid-cap (-23.5%)1 and small-cap (-30.7%)2 stocks through the same time period. We will be writing more about large cap growth names’ distortion of various indices in future blogs, please make sure to sign up to receive our market insights.

1S&P Mid Cap 400 Index
2S&P Small Cap 600 Index