This blog was originally posted in December 2020, republished with updated data.
Of the many charts illustrating the enormous run-up of growth stocks in the past few years, the chart below may take the cake.
Tesla (TSLA) began 2020 with a market capitalization under $100 billion, and by November 25th, 2020 had a value of over $500 billion — a five-fold increase. As of the writing of this blog, Tesla now boasts a higher market cap than Berkshire Hathaway — the conglomerate run by Warren Buffett which consists of venerable businesses such as: GEICO, Burlington Northern Santa Fe, Benjamin Moore, NetJets, Duracell, Dairy Queen, and many more.
Market Cap Comparison ($1,000,000s)
Tesla versus Berkshire Hathaway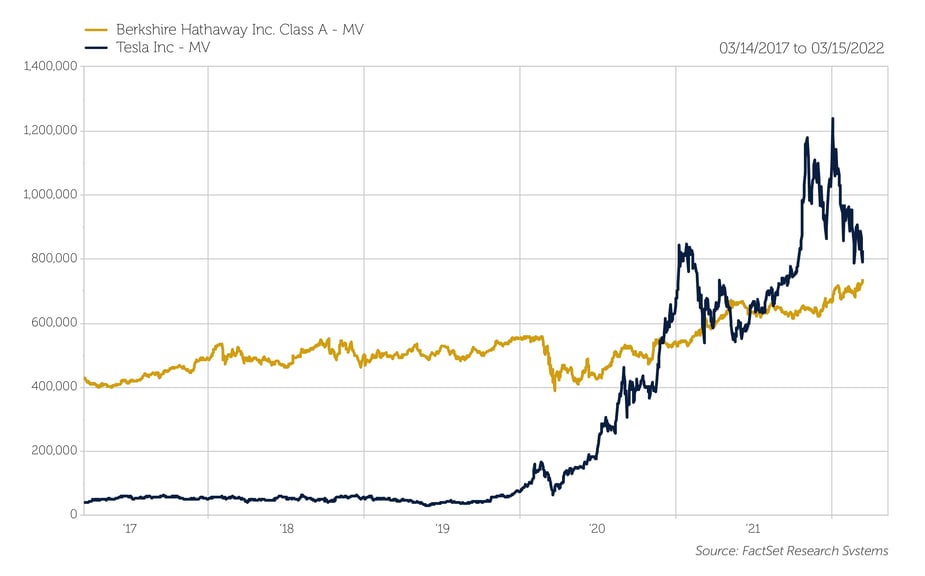

To put the stock’s rally into context, back in March 2020, Berkshire Hathaway had enough cash and short-term investments (around $100B) to buy Tesla outright as its market cap fell below $100B. In terms of revenue, Berkshire earned $255B in revenue in 2019 — ten times Tesla’s revenue of $25B.1
Has Tesla really increased shareholder value by 500% in two years? Not likely, but the company’s 5:1 stock split and the announcement of its inclusion into the S&P 500 Index was enough to heighten the already-lofty sentiment around the stock. Using estimated 2020 earnings, Tesla’s stock has been trading at a price-to-earnings ratio of roughly 283x (depending on the day) compared to less than 30x for the S&P 500 Index.
1Markets Insider. Business Insider.